Projects


Reflex Wearable
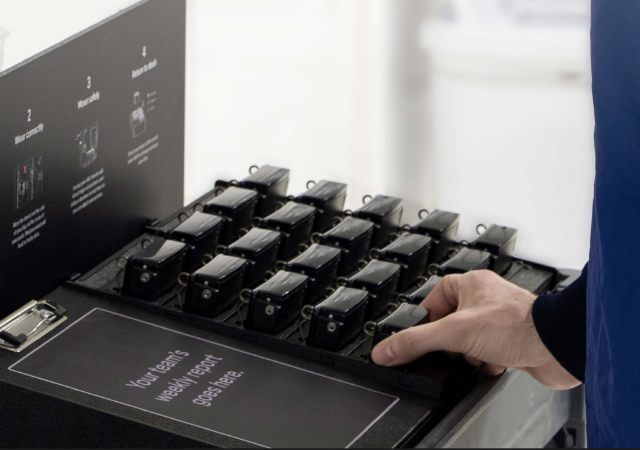
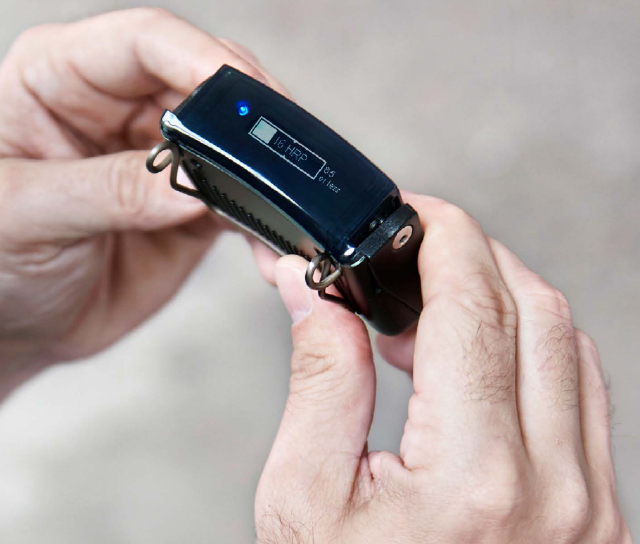
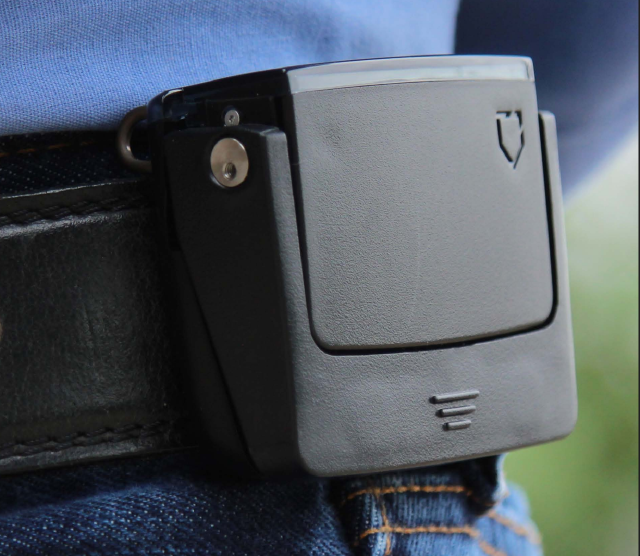
The Reflex wearable system is used to prevent strain-and-sprain injuries at the workplace. It does this by providing real-time feedback (vibration) when a worker is engaging in a risky lifting, twisting, or jumping activity. Also an IoT connected product, the Reflex system will upload additional metadata and telemetry when the device is placed back in it’s charging cradle at the end of a shift. See Kinetic’s Whitepaper for more information about the impact and accomplishments of the Kinetic platform.
The Reflex wearable uses a smart 6-axis IMU and an altimeter to capture the user’s orientation in space. These datastreams are combined using Kinetic’s custom sensor-fusion algorithm to track changes in activity and orientation consistent with risky postures. An embedded linux SOM is used to collect+store data, run the data processing algorihm, run the UI, and upload results to the cloud via Wifi.
I joined this product just in time to help Kinetic rapidly scale up Reflex production. I rewrote Factory Testing, QC/QA, Battery maintenance and Cellular management processes to ensure consistent quality of product and user experience. I contributed a great many bugfixes to the firmware codebase and to the mechanical assmblies, as well as fleetwide data analysis for preventative battery maintenance. I also lead design of an upgraded next-generation version of the wearable (not pictured here).
Merchandiser Cup
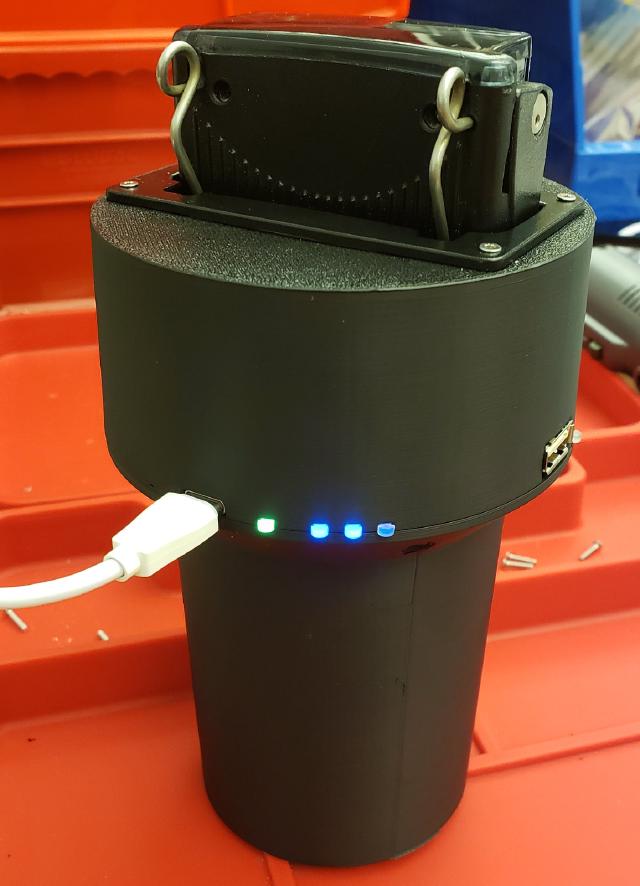
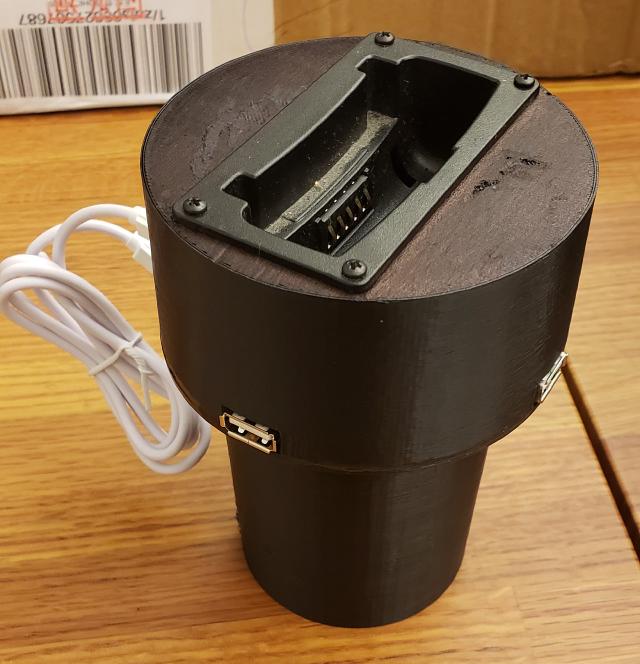
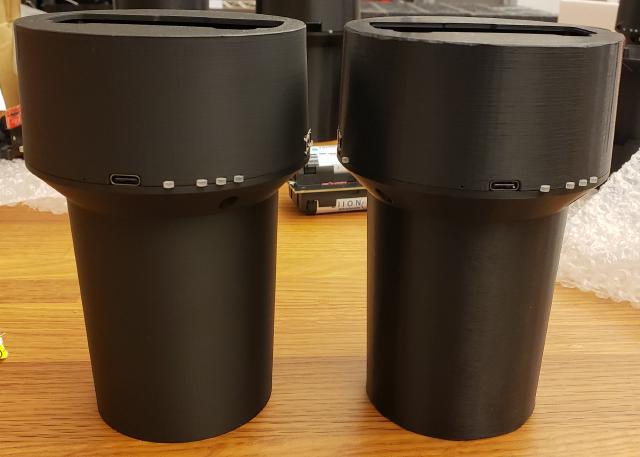
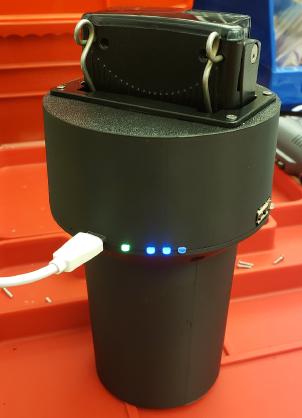
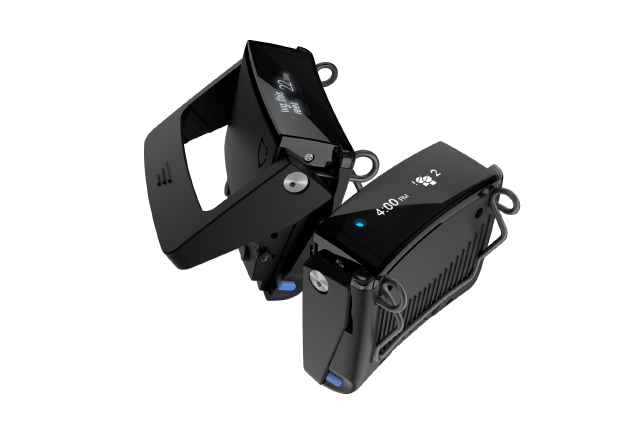
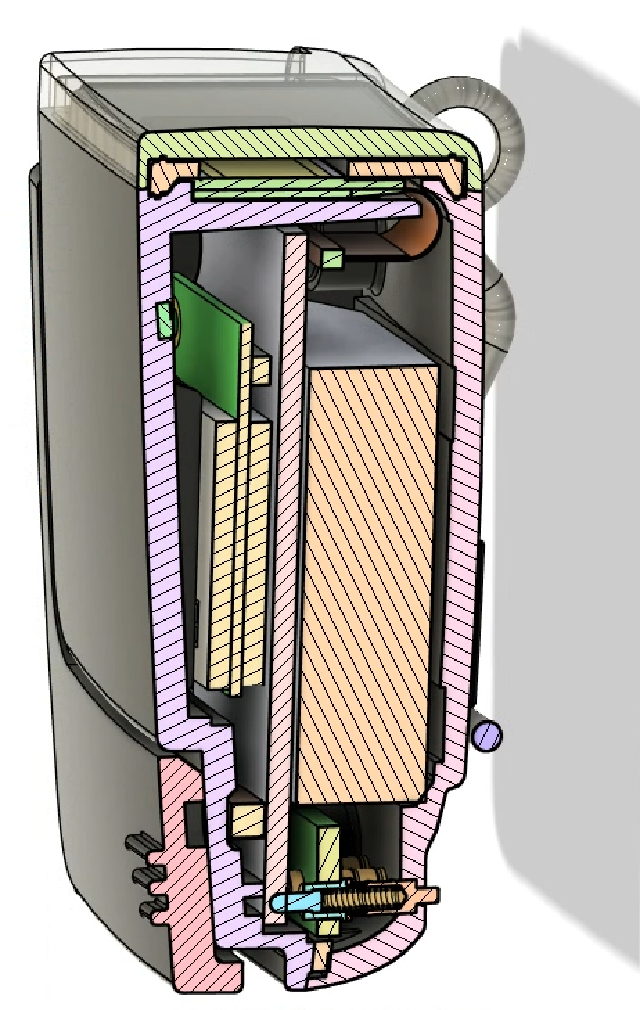
The Merchandiser Cup is a prototype connected charger for the Kinetic Reflex system. It enables a Reflex device to be taken on the road in situations where a worker doesn’t return back to a centralized warehouse or charging hub. The product is a combination 10Ah powerbank, device charger, cellular uplink and wifi hotspot, all sized to fit in a car cupholder. The connectivity features allow the Reflex device to upload it’s data over wifi when docked at the end of the day. We ran a 50-unit beta pilot of this project with delivery workers.
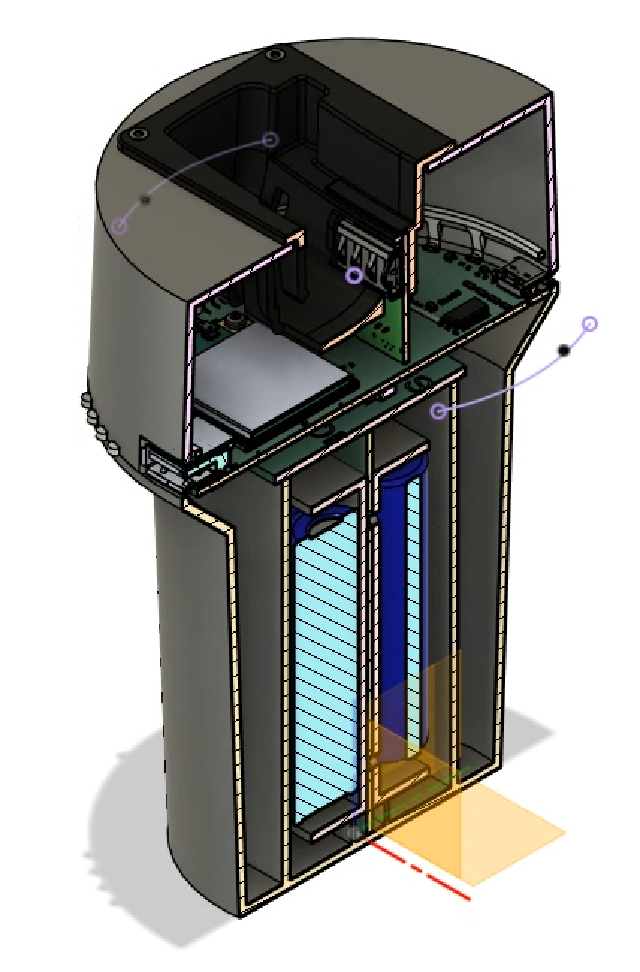
The cup is built around an ESP32 Wifi module acting as a Wifi-AP when the Reflex device is docked and charging. It communicates with a Cat-4 LTE cellular modem using PPPD for transparent relay of data traffic to/from the Reflex wearable. The cup has advanced power management features which allow a user to charge their mobile devices and in-car equipment via USB-A ports when upstream USB-C PD power is available, up to 30W. The project leans on the ESP-IDF C API, FreeRTOS, and AWS IOT libraries.
I lead product development and electrical design of this product from the early R&D phase. I wrote POC firmware demonstrating the concept, and contributed to production firmware later on in the project. I also created the mechanical design, including plastic enclosure and card-edge PCB mating surfaces.
o27-SoundEffects

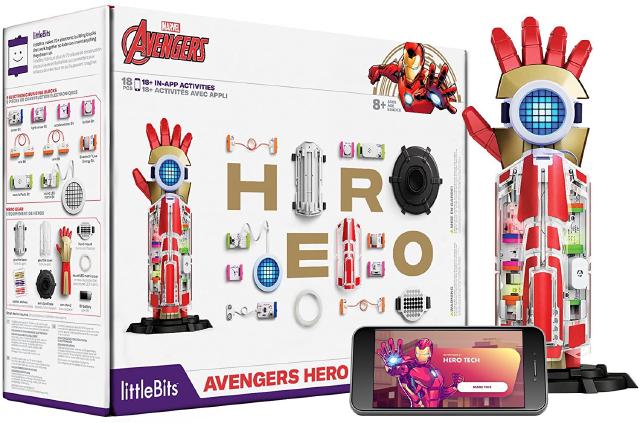
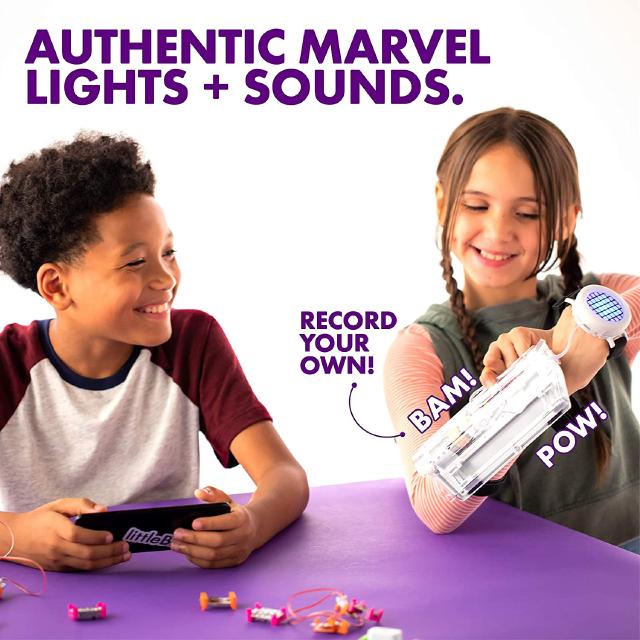
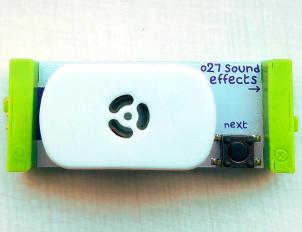
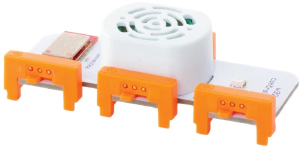
The o27-soundEffects bit was a component of the Avengers Hero Inventor Kit. It allowed users to trigger sound clips from the onboard button, or from other bits in the littleBits portfolio (buttons, switches, sensors, etc). The soundEffects bit came pre-loaded with 80 sound effects, and also provided room for users to upload their own sound files for playback.
The design was heavily based on the w32-soundEffects bit, built around the same silabs EFM8 8051 MCU. However the speaker enclosure and amplifier were optimized and acoustically tuned for the sound effects in the pack (as well as increasing the maximum SPL).
A novel system was created whereby the bit could accept either analog or UART signals on it’s input bitsnap. By default it would be triggered by rising edges of the analog signal, but if UART frames in the correct format were sent, they would be parsed instead. The UART frames used a similar protocol to that of the w32-controlHub, and allowed the user to upload new sound effects.
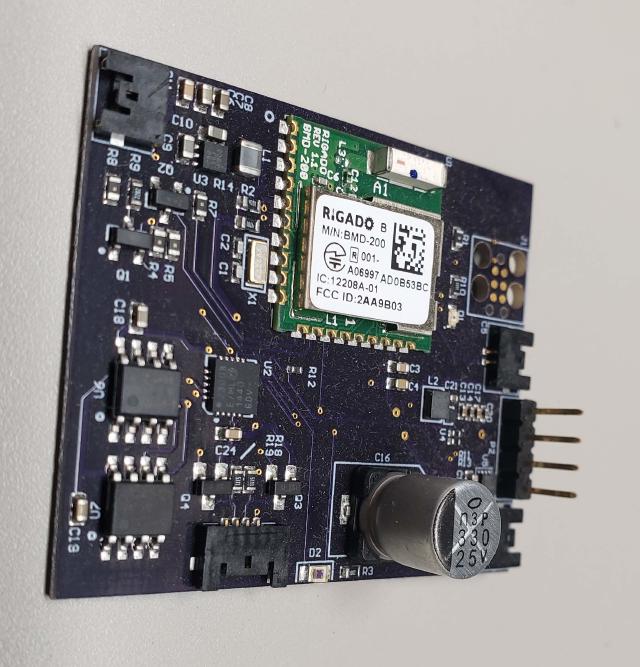
w32-ControlHub

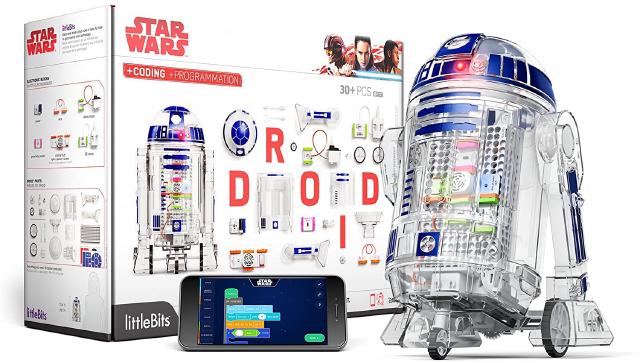
The w32-controlHub was a key component of the littleBits Droid Inventor Kit. It acts as the brain of the build-it-yourself robot, allowing several functions of the droid to be controlled over Bluetooth Low Energy (BLE). The controlHub communicates with a mobile application and allows a user to read from inputs, write to outputs, play back sound effects, and run rudimentary user programs. The Droid Inventor Kit included many other parts from the littleBits platform as well as a custom plastic assembly enabling users to assemble their own Droid.
The design was built around a Nordic nRF51-series BLE Radio SoC (used for communication) and a Silicon Labs EFM8 8051 MCU (for sound playback and I/O). Audio files were stored on a small SPI NOR flash chip, played back in a Class-D fashion through a small amplifier and speaker. Low-lanecy operations like SFX playback and output PWM were implemented on the 8051 coprocessor. A custom storage format was written for the flash chip, and a communication protocol for control and configuration.
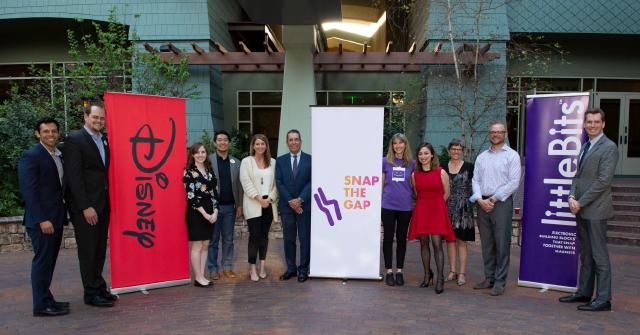
I was a part of the team that was invited to participate in the 2016 Disney Accelerator Program. We pitched a variety of concepts to executives within the Disney corporation, leading to a partnership that produced the Droid Inventor Kit. I helped the team to develop the kit concept, designed the w32-controlHub bit, assisted the software team with device communications, edited the audio for the project, and was boots-on-the-ground during our very ambitious ramp up at a CM in southern China.
Grow Duo
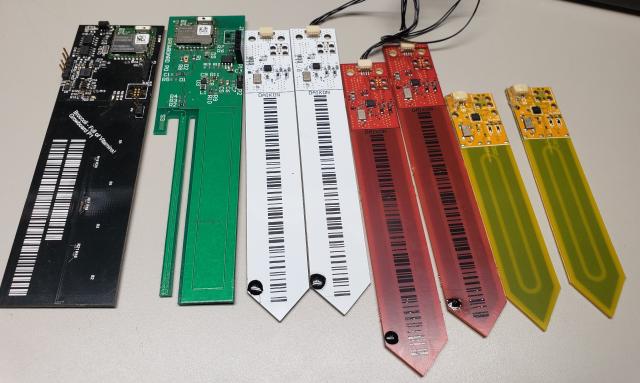

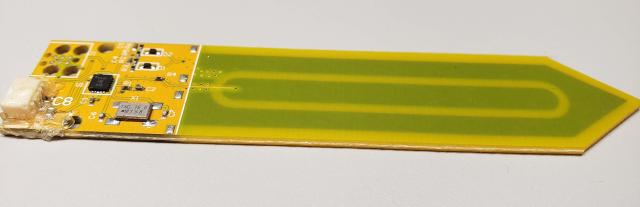
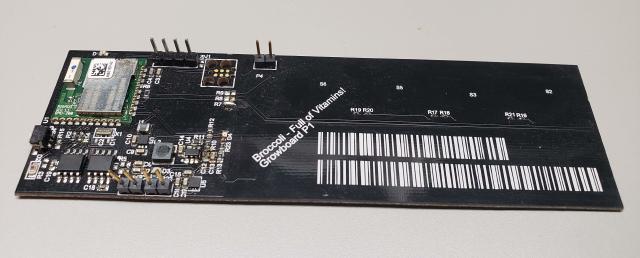
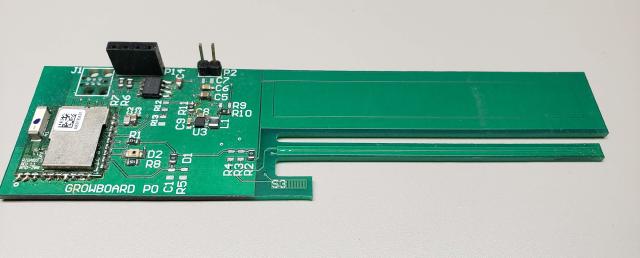
The Grow Duo was an internet-connected growbed, intended to help the plant-illerate get access to their own freshly grown fruits and vegetables. The growbed contains a variety of sensors that help to monitor plant growth, and a valve to dispense the optimal amount of water. Progress could be tracked over BLE, and a mobile application prompted the user when it was time to harvest.
The Duo was based around a Nordic Semi BLE SoC and a small remote sensor PCBA with an Atmel ATTINY MCU. The nRF SoC sampled from several i2c sensors and analog photodiode and logged the data to flash memory. The nRF was also responsible for running watering logic based on the sensor stream inputs and behavior scheduled in the mobile application.
I assisted this project during the bulk of it’s development, primarily supporting the device firmware. I created a subsystem for storing and recalling records from flash without disrupting BLE communications, as well as a communications protocol for configuration, recall, and debugging.
Sum Labs Wearable
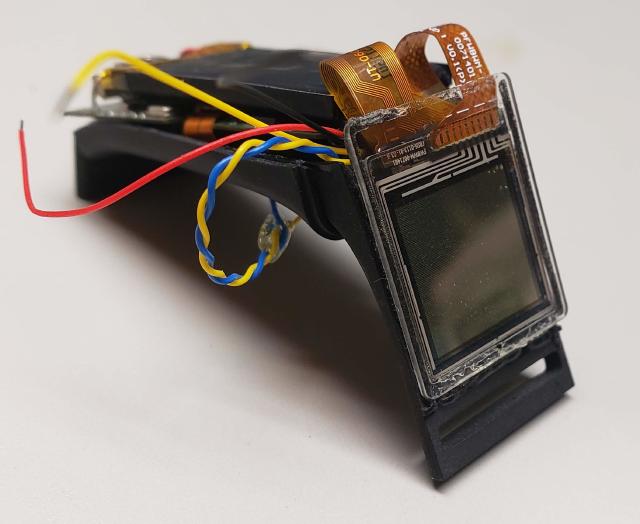
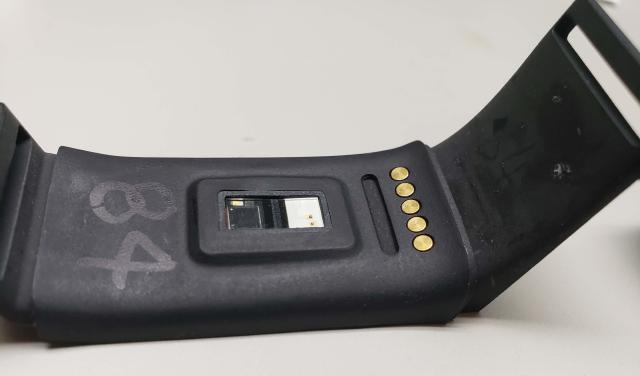
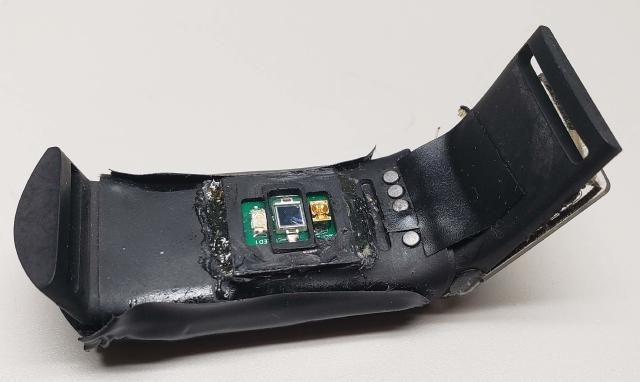
Sum Labs (formerly Project Florida) was a startup focused on wellness. Their first offering was slated to be a wristworn health monitor that assisted users in tracking their hollistic well-being. The wearable analyzed the user’s pulse and used a novel algorithm to give the user insight into their mental state, including the amount of time spent in areas of focus and calm.
The wearable was built around an STM32 MCU and a CSR Hybrid Bluetooth chipset. The device stored a mixture of raw and computed data to it’s onboard QSPI NOR Flash Memory. A custom Analog Front-End was created for the Pulse Plesmography (PPG) sensor.
I worked on this project at the R&D phase, primarily quantifying sensor performance and working with the external hardware and firmware partners to validate the product. We whittled down the list of relevant sensor streams and put an enormus amount of effort into our own PPG front-end and signal-processing algorithms for retrieving pulse and blood-oxygen level values. I also created tooling for a clinical trial of the device, and assisted the trial in-person.
DreamOn
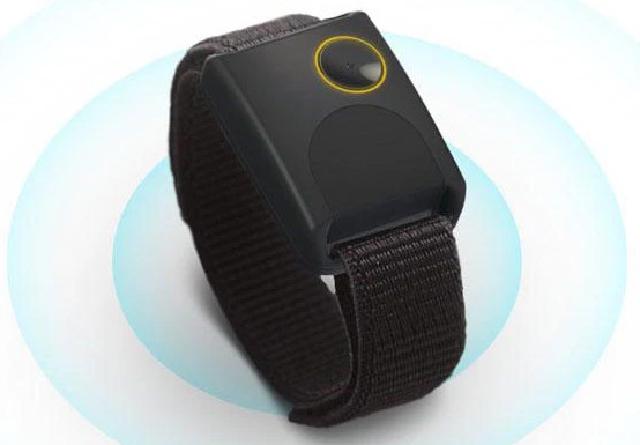
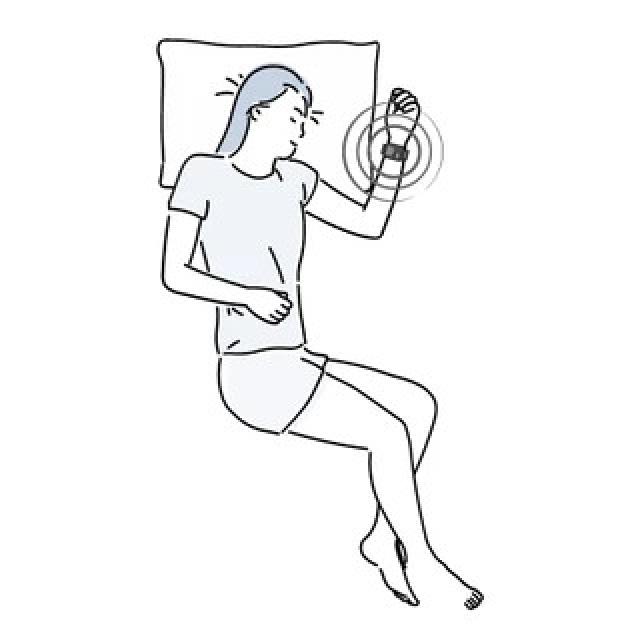
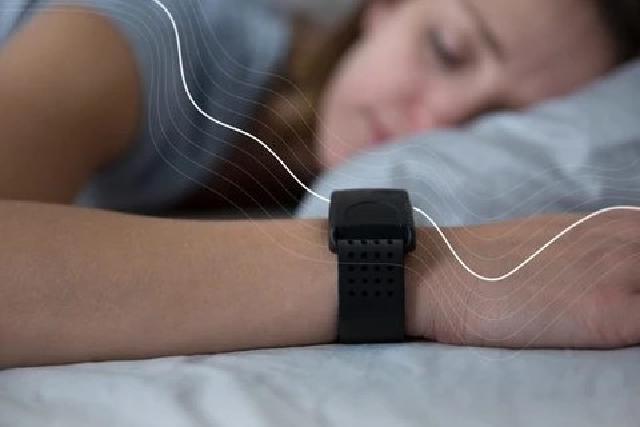
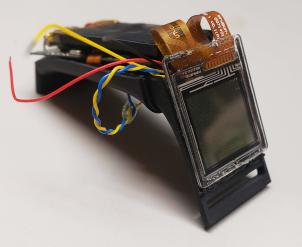
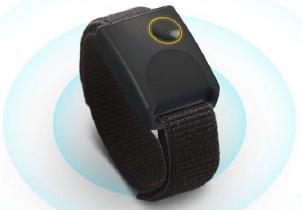
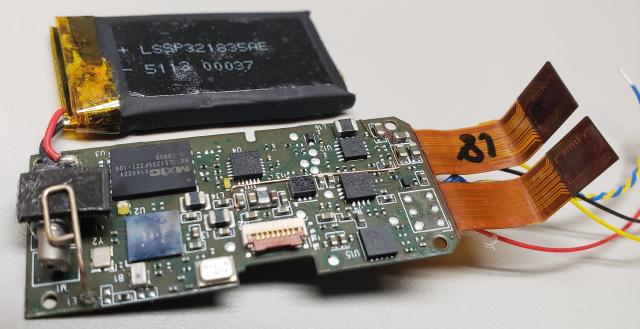
The DreamOn wearable is a wrist-worn sleep-aid. The device produces a naturally calming sensation through subtle vibration. The vibration is similar to that of a gentle heart-beat, and encourages the generation of lower-energy brainwaves.
I worked on this product primarily at the early prototpying phase. We iterated over several options for the primary actuator (that generates the gentle pulse). We used a novel drive circuit to generate the perfect sensation while fitting within our power budget.
I rejoined the project at a late stage to assist with mass-production. We reworked the firmware to support over-the-air updates and worked with the factory to complete compliance testing and DFM.
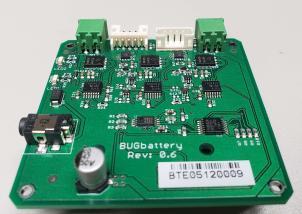
Buglabs BugBattery

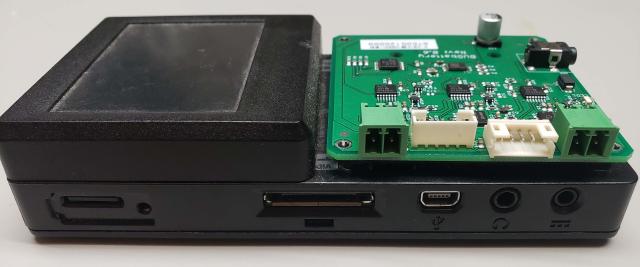
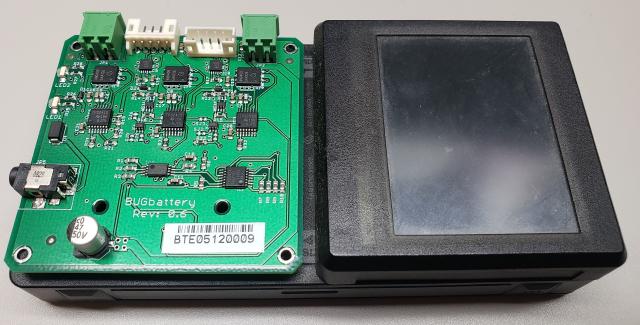
This was an addon module to the Buglabs BugBase modular IoT platforming system: a battery-powered embedded linux base station with various plug-in modules. The BugBattery allowed for the addition of several backup power sources for the Buglabs system - several Li-ion batteries could be connected, charged, and discharged in priority order, as well as an auxillary power input. This project also involved creating custom Li-ion battery packs with built-in fuel gauging to measure the battery level.
On this design I worked closely with engineers within TI to create a complex power-path for the multiple batteries and sources. We also worked with an external vendor to create the custom battery packs. Some glue logic and i2c switching was required to pull the project together.
Buglabs RF4CE
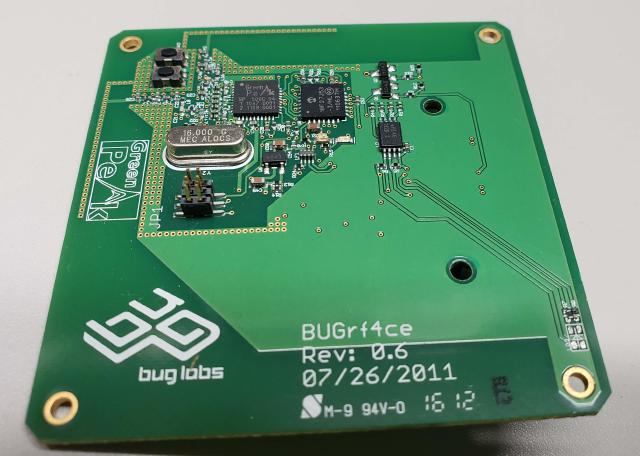
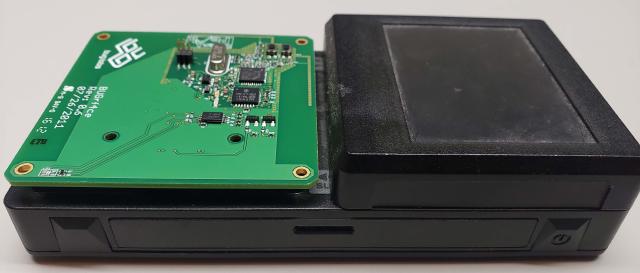
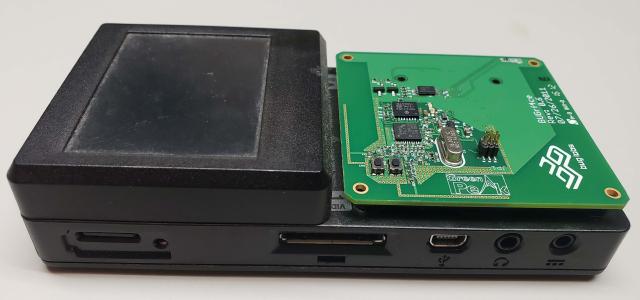
This was an addon module to the Buglabs BugBase modular IoT platforming system: a battery-powered embedded linux base station with various plug-in modules. The RF4CE module was requested by a client to create a proof-of-concept set-top box. RF4CE is a Zigbee protocol designed for use with remote controls. With this module, the BugBase could receive commands from a connected remote and create a GUI for use with a TV.
The RF4CE module was based around a GreenPeak RF4CE controller, and it leveraged the USB connection exposed over the modular connector. It was one of my first RF designs, so I was able to very closely follow the dual inverted-f antennas on the reference dongle.